Plot methods for objects of class "tscomparison", threeRuleSmooth
and twoStepsBenchmark. :
plotdraws a plot with base graphicsautoplotproduces a ggplot object
Objects of class tscomparison can be produced with the functions
in_sample, in_scatter, in_revisions, in_disaggr.
Usage
# S3 method for class 'twoStepsBenchmark'
plot(
  x,
  xlab = NULL,
  ylab = NULL,
  start = NULL,
  end = NULL,
  col = default_col_pal(x),
  lty = default_lty_pal(x),
  show.legend = TRUE,
  main = NULL,
  mar = default_margins(main, xlab, ylab),
  ...
)

# S3 method for class 'threeRuleSmooth'
plot(
  x,
  xlab = NULL,
  ylab = NULL,
  start = NULL,
  end = NULL,
  col = default_col_pal(x),
  lty = default_lty_pal(x),
  show.legend = TRUE,
  main = NULL,
  mar = default_margins(main, xlab, ylab),
  ...
)

# S3 method for class 'tscomparison'
plot(
  x,
  xlab = NULL,
  ylab = NULL,
  start = NULL,
  end = NULL,
  col = default_col_pal(x),
  lty = default_lty_pal(x),
  show.legend = TRUE,
  main = NULL,
  mar = default_margins(main, xlab, ylab),
  ...
)

# S3 method for class 'twoStepsBenchmark'
autoplot(
  object,
  xlab = NULL,
  ylab = NULL,
  start = NULL,
  end = NULL,
  col = default_col_pal(object),
  lty = default_lty_pal(object),
  show.legend = TRUE,
  main = NULL,
  mar = NULL,
  theme = default_theme_ggplot(object, start, end, show.legend, xlab, ylab, mar),
  ...
)

# S3 method for class 'threeRuleSmooth'
autoplot(
  object,
  xlab = NULL,
  ylab = NULL,
  start = NULL,
  end = NULL,
  col = default_col_pal(object),
  lty = default_lty_pal(object),
  show.legend = TRUE,
  main = NULL,
  mar = NULL,
  theme = default_theme_ggplot(object, start, end, show.legend, xlab, ylab, mar),
  ...
)

# S3 method for class 'tscomparison'
autoplot(
  object,
  xlab = NULL,
  ylab = NULL,
  start = NULL,
  end = NULL,
  col = default_col_pal(object),
  lty = default_lty_pal(object),
  show.legend = TRUE,
  main = NULL,
  mar = NULL,
  theme = default_theme_ggplot(object, start, end, show.legend, xlab, ylab, mar),
  ...
)
Arguments
- x
(for the plot method) a tscomparison, a twoStepsBenchmark or a threeRuleSmooth.
- xlab
the title for the x axis
- ylab
the title for the y axis
- start
a numeric of length 1 or 2. The start of the plot.
- end
a numeric of length 1 or 2. The end of the plot.
- col
the color scale applied on the plot. Could be a vector of colors, or a function from n to a color vector of size n.
- lty
the linetype scales applied on the plot. Could be a vector of linetypes, or a function from n to a linetypes vector of size n.
- show.legend
TRUEorFALSE. Should an automatic legend be added to the plot.- main
a character of length 1, the title of the plot
- mar
a numeric of length 4, the margins of the plot specified in the form
c(bottom, left, top, right).- ...
other arguments passed either to ggplot or plot
- object
(for the autoplot method) a tscomparison, a twoStepsBenchmark or a threeRuleSmooth.
- theme
a ggplot theme object to replace the default one (only for autoplot methods)
Examples
benchmark <- twoStepsBenchmark(turnover,construction,include.rho = TRUE)
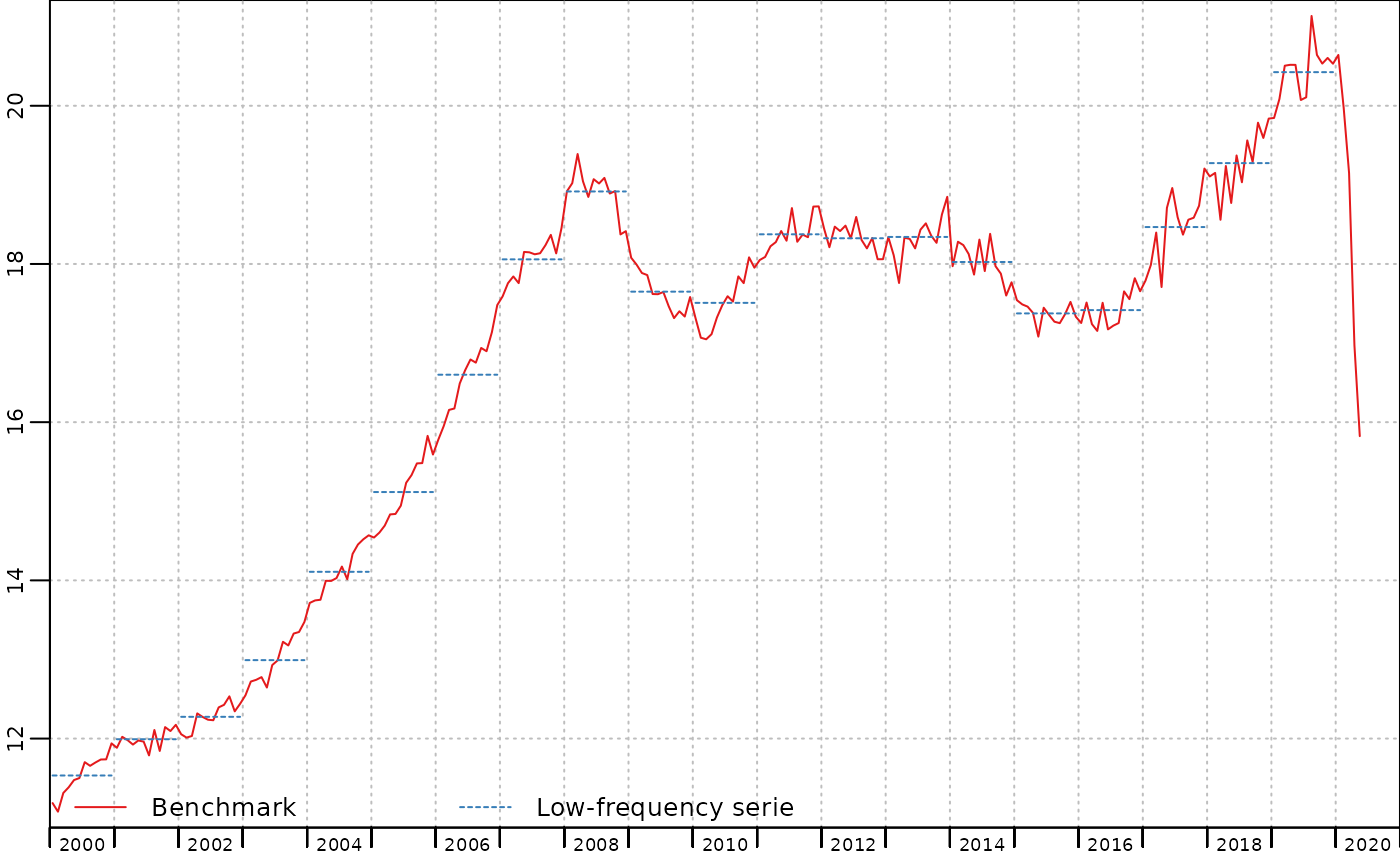
plot(benchmark)
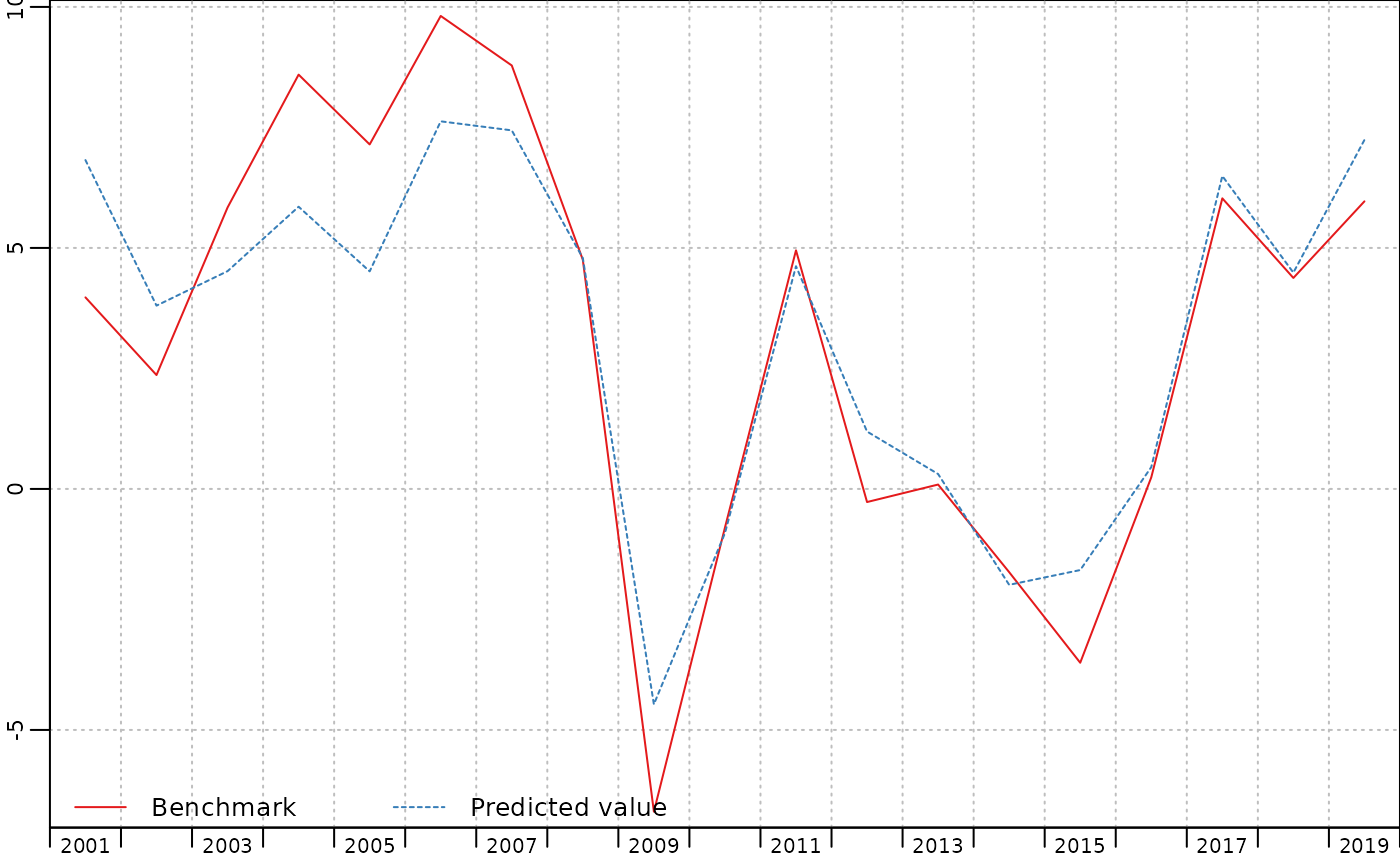
 plot(in_sample(benchmark))
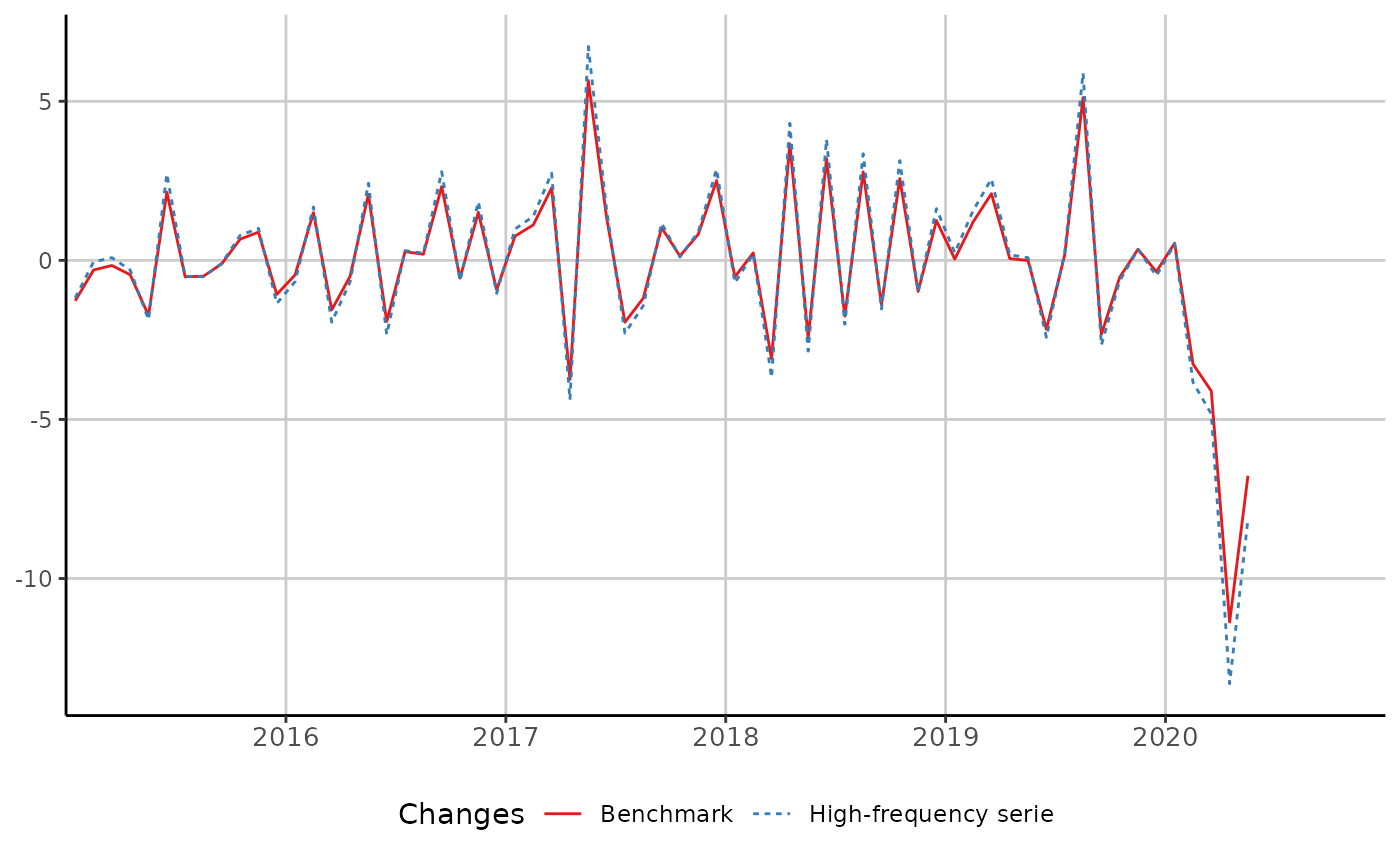
 if(require("ggplot2")) {
autoplot(in_disaggr(benchmark,type="changes"),
start=c(2015,1),
end=c(2020,12))
}
#> Loading required package: ggplot2
if(require("ggplot2")) {
autoplot(in_disaggr(benchmark,type="changes"),
start=c(2015,1),
end=c(2020,12))
}
#> Loading required package: ggplot2
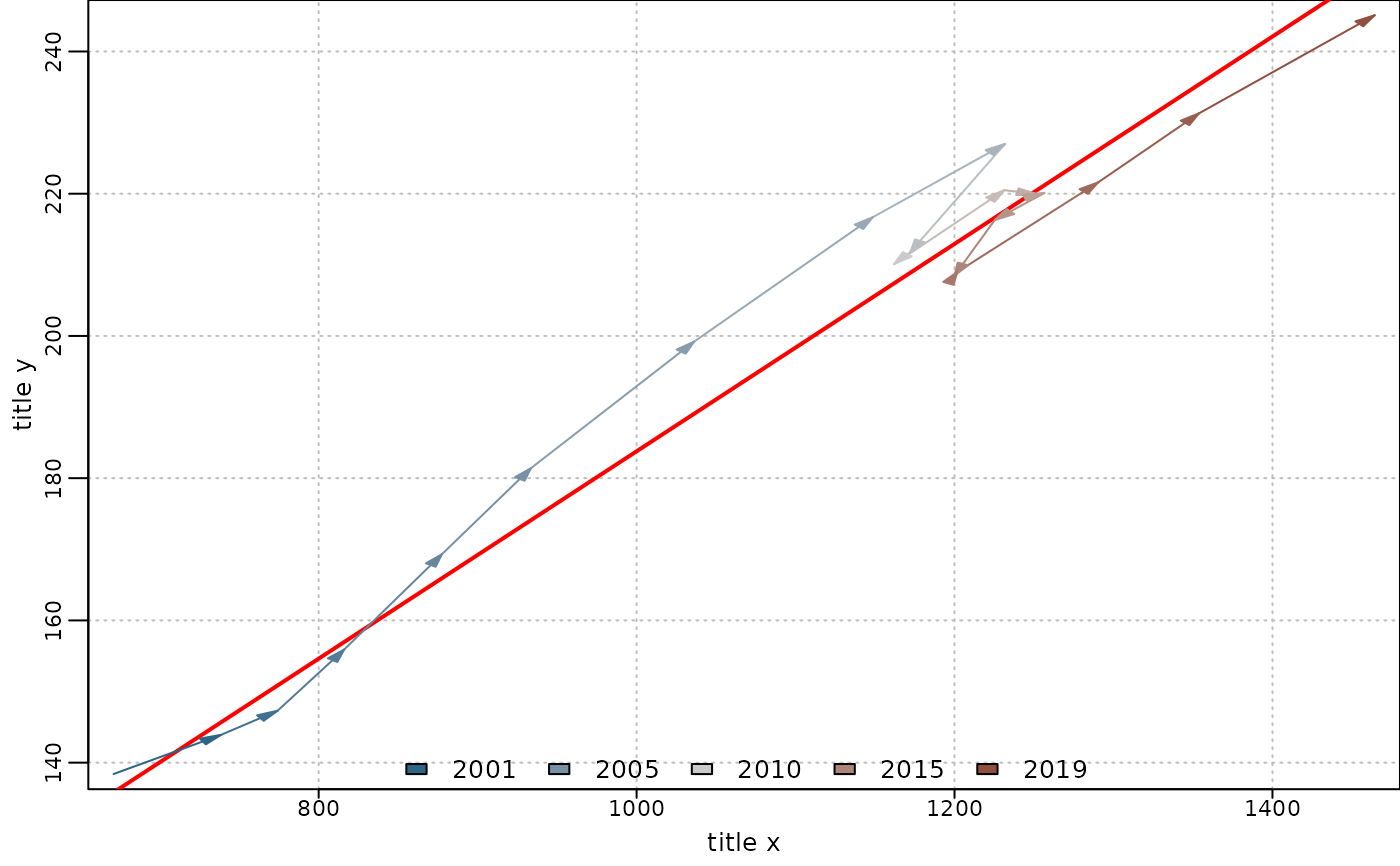
 plot(in_scatter(benchmark),xlab="title x",ylab="title y")